The SysAid Copilot Usage Dashboard provides a powerful window into how an AI-driven workspace is transforming IT service management. Designed to help measure SysAid's AI capabilities' adoption, performance, and efficiency, this dashboard brings together key usage metrics from across the organization in a single, actionable view.
By tracking engagement across chatbot conversations and AI usage, you can gain a holistic understanding of how AI is being used, where it's making the most impact, and where there are opportunities for deeper integration and smarter automation.
How it works
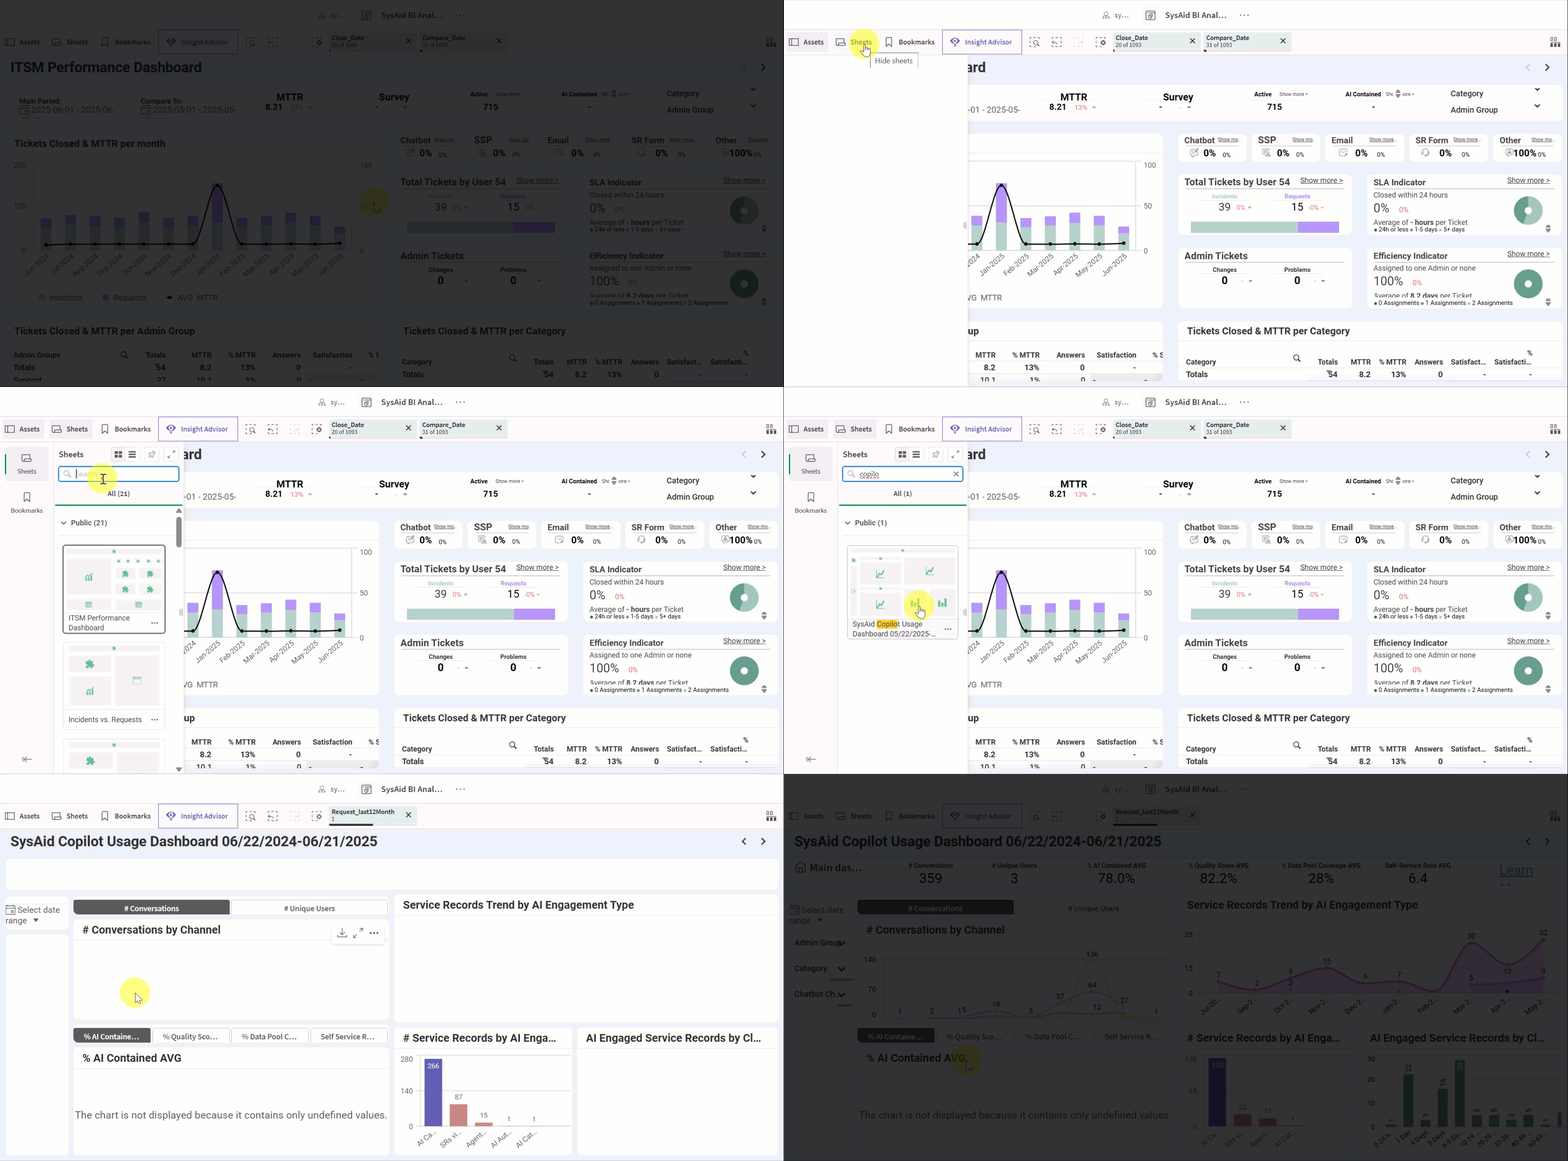
To view the dashboard:
Go to Analytics > BI Analytics
Select the SysAid Copilot Usage Dashboard sheet.

The Copilot Usage Dashboard is divided into 4 main areas:
Top Bar: Displays essential KPIs like total AI chatbot conversations, unique users, AI containment rate, and answer quality. When hovering over each parameter, you’ll see a short description of what it includes and how it is calculated.
Left side: Highlights user engagement trends across channels and tracks AI-generated service activity over time.
Right side: Focuses on AI performance - how well features like summarization and categorization impact service record handling and resolution time.
Filters: Date, service record category, and Chatbot channel filters can be found on the left-side panel and will affect all the data displayed in the dashboard.
This layout gives a full picture of AI adoption, efficiency, and user behavior in one unified view.
Tip:
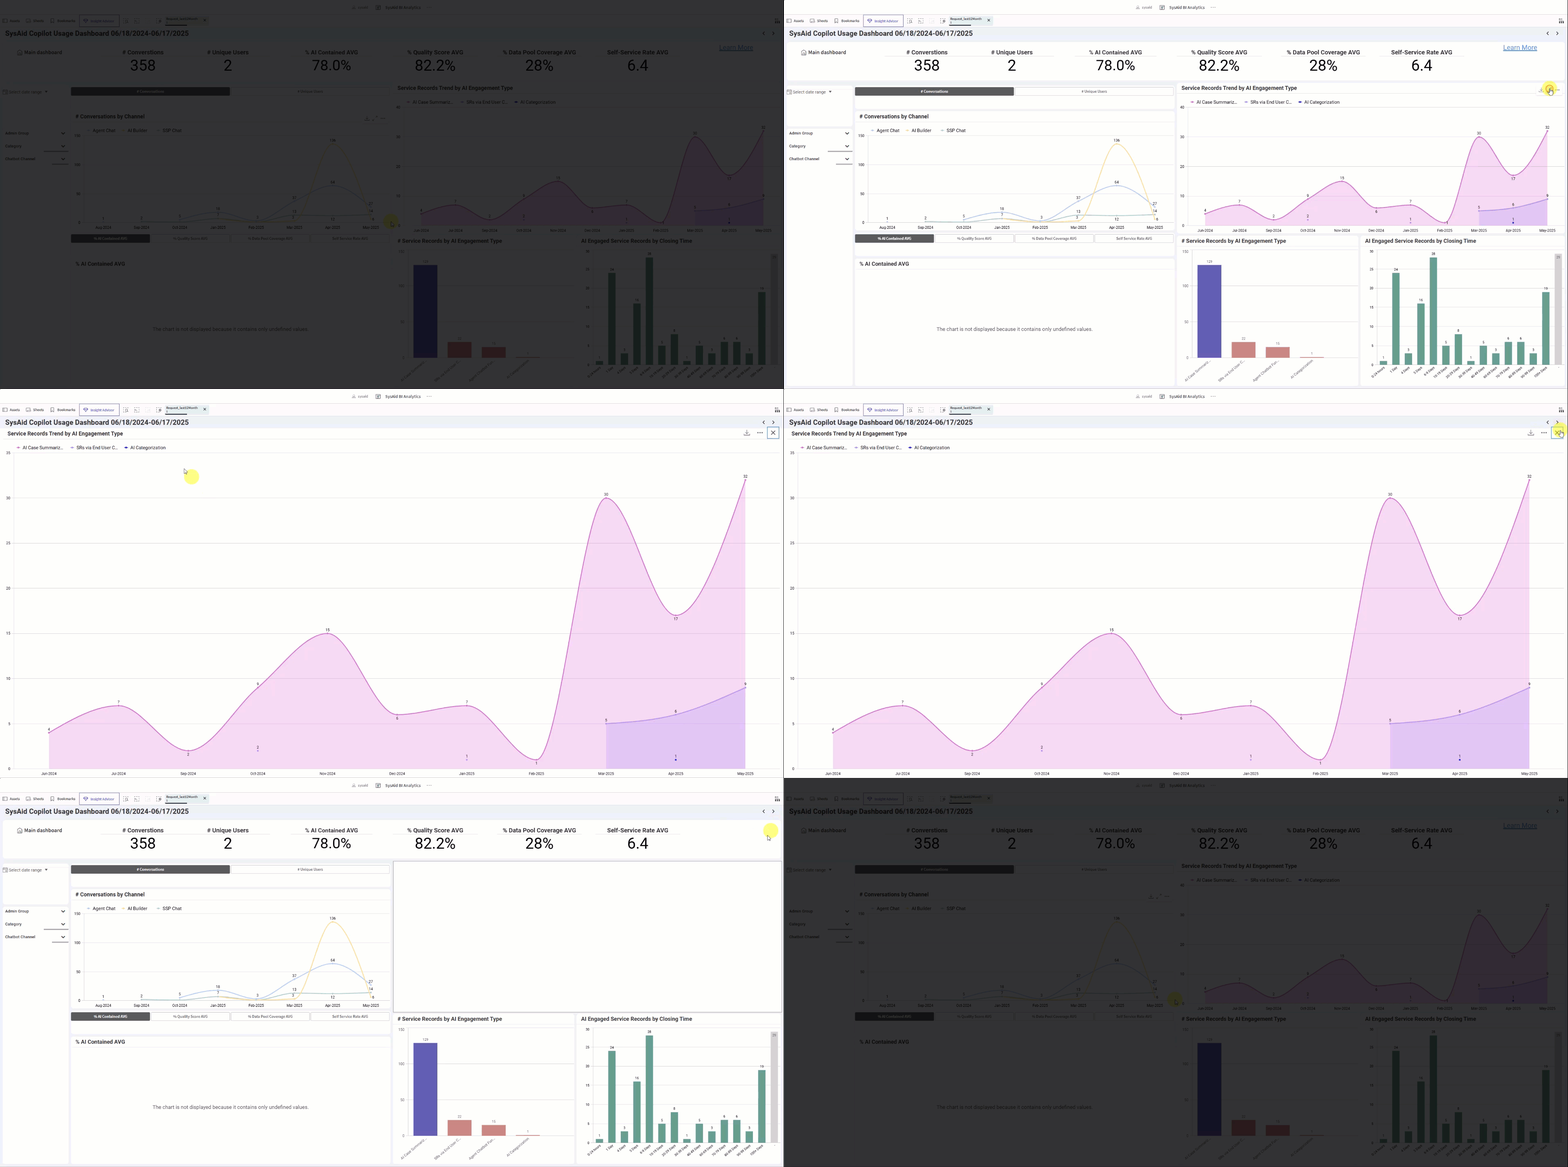
Each individual chart can be expanded by hovering over it and clicking the maximize (arrows) icon.
Dashboard metrics
# Conversations
The total number of conversations users have had with different AI channels in the selected date range. This includes all available chatbots:
End User Chatbot (on all three channels):
Self-Service Portal
MS Teams
Emailbot
Agent Chatbot
AI Agent Builder Chatbot
You can go to the #Conversations by Channel chart section to see a breakdown of the number of conversations per channel.
You can also switch the view from #Conversations to #Unique Users by switching the tab at the top.
# Unique Users
The number of unique users who engaged with a Chatbot. This includes end users and IT agents.
% AI Contained AVG
The percentage of Self-Service Portal and MS Teams chatbot conversations that did not result in the creation of a service record. This represents the percentage of service records deflected by these channels.
The Agent Chatbot, Emailbot, and AI Builder Chatbot interactions are not included in this metric’s calculation.
% Quality Score AVG
Reflects how well your AI Copilot is performing when it comes to delivering meaningful and helpful responses to end users. This metric combines multiple indicators, like whether a service record was successfully created, how users rate the response (thumbs up/down), and how well the AI fulfilled its intended function.
A higher score means that your Copilot is effectively assisting users and meeting their expectations. For example, a 58.6% Quality Rate shows that the AI responses were judged positively or led to a successful outcome in nearly 6 out of every 10 cases.
Tip:
To learn more about how the quality score is calculated, see Quality Score Calculation Overview.
% Data Pool Coverage AVG
This parameter shows how much your Copilot AI relies on your organization's trusted knowledge sources when responding to users. A higher percentage means the AI is pulling answers from the content you’ve provided, such as internal articles, documentation, or FAQs, rather than guessing.
This leads to more accurate, consistent, and helpful responses across your service channels. For example, a 31% data pool coverage means that almost 1/3 of AI responses are backed by your own content, helping ensure every answer reflects your unique business knowledge.
% Self-Service Rate AVG
This calculates how self-serving the End User Chatbot’s answer is, meaning how likely the user is to solve their issue using it. The more detailed and focused the answer, the more points this response will receive.
Charts
# Conversations by Channel
This section provides a breakdown of AI-related conversations across various channels over time. It helps you track when and where users are engaging with AI-powered support. The channels typically include:
Agent Chatbot: Conversations between users, Agents, and the AI Agent Chatbot.
AI Builder: Conversations between Agents and the AI Agent Builder Chatbot.
SSP Chatbot: Conversations between end users and the AI End User Chatbot.
Email: Interactions with the Emailbot.
MS Teams: Conversations through Microsoft Teams (if integrated).
This chart offers a quick visual comparison of usage trends across channels, helping identify where AI engagement is most active.
Beneath the chart, you'll find four tabs that allow you to explore specific AI-related performance metrics over time:
% AI Contained AVG: The average percentage of conversations successfully handled by AI without human intervention.
% Quality Score AVG: The average quality score of AI responses, indicating how effectively the AI supported the user.
% Data Pool Coverage AVG: Reflects how much of the conversation content was recognized and supported by your organization’s data pool.
Self-Service Rate AVG: Measures how frequently users resolved their issues through AI and self-service tools, without opening service records.
These tabs allow you to drill down into key performance indicators that reveal the effectiveness and reach of your AI deployments across different channels.
Service Record Trends by AI Engagement Type
This shows a breakdown of AI functions and how many service records are touched by each function. These include:
Service records created via the End User Chatbot
AI Category Suggestions: Service records where the user actively chose the AI suggested categories
AI Agents: Every action an AI Agent performs on a service record
Email Answered: Service records that received an answer from the Emailbot
Filters
Date range: By default, the dashboard shows data that spans across the last 12 months. You can click Select date range on the left to adjust the presented data timeframe.
Admin Group: You can filter the data to view the engagement for a specific Admin Group. This will show you both how often they use AI features and how many service records they’ve handled.
Category: You can filter the data according to specific service record categories.
Chatbot Channel: You can filter the data according to the specific AI communication channel you want to focus on.
Tip:
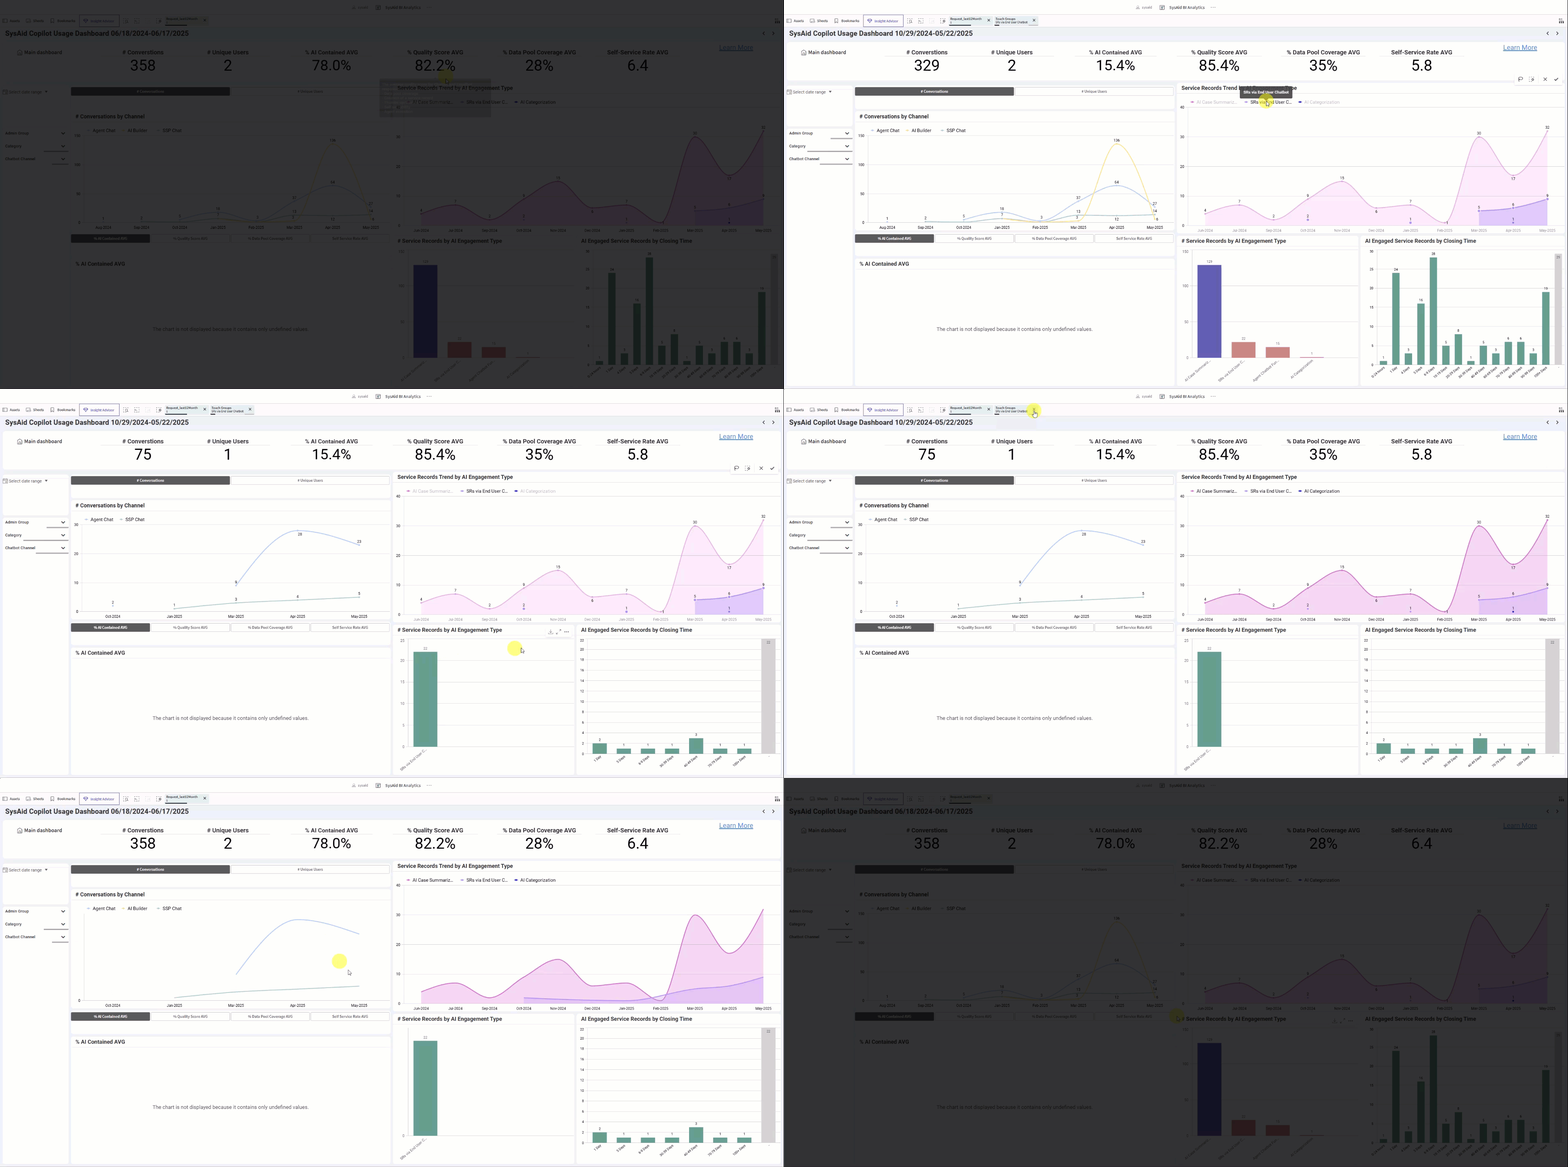
Clicking on any trendline in the charts will filter the entire dashboard accordingly. You can remove any filter by closing the relevant filter tab at the top.
Tips to boost metrics
Improving your AI performance metrics requires active monitoring and optimization. Here are a few key practices to help boost your AI results:
1. Monitor and fine-tune AI responses
Regularly review AI conversations and refine answers to improve quality scores. Fine-tuning ensures that users receive more accurate, helpful responses over time.
To learn more, see Monitor and Fine-tune.
2. Update and expand the Data Pool
Keep your AI informed by continuously updating your data pool. Add new, relevant resources and remove outdated ones, to ensure the AI has access to the latest information and can support a wider range of questions.
To learn more, see Data Pool.
3. Adjust data set settings
Make sure each data set is prioritized correctly by adjusting its settings. Configuring relevance and attention levels helps the AI make better use of your most important content.
To learn more, see AI Chatbot Advanced Configurations.
4. Encourage user feedback
Drive user engagement by encouraging feedback on AI answers. Thumbs up/down ratings provide essential insights into what’s working and what needs fixing.
Proactive management in these areas will lead to stronger containment rates, higher quality scores, and a better overall experience for your users.

