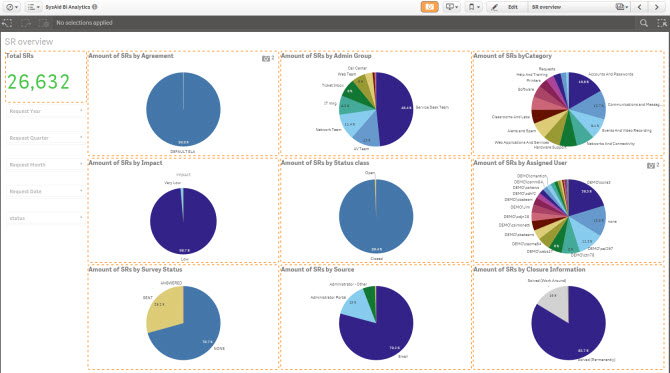
You can create presentations that include images of charts from your system. These presentations can be helpful in discussing the data or proving what course of action the data points to.
For general information on BI Analytics, see BI Analytics.
For information on filtering data in BI Analytics, see Filter BI Data.
For information on the various graphs or charts available for displaying your data, see BI Analytics Chart Options.
Snapshots
There are many ways to take snapshots of your data in BI Analytics. These snapshots are static images and do not update as the data changes. However, snapshots are linked to the live charts from which they were taken.
Snapshot Mode
Snapshot mode enables you to take multiple snapshots in rapid succession of any chart or object displayed in BI Analytics.
To take a snapshot with Snapshot mode
Click
 .
.
All of the objects on the sheet are surrounded by a dotted line.Click objects to record snapshots.
The number in the corner of an object indicates how many snapshots were taken of that object.When you are finished taking snapshots, click
 .
.

Individual snapshot
If you just want to take a snapshot of a single object, you can do so through the object's right-click menu option.
To take a snapshot of an individual object
Right-click the object.
From the Right-Click menu, click
 .
.
Delete a snapshot
Click
 .
.
All of the objects on the sheet are surrounded by a dotted line.Locate the object whose snapshot you want to delete.
Click the Snapshot icon in the top-right corner of the object to open the object's snapshot library.
Click
 .
.Select the check box corresponding to the snapshot you want to delete.
Click
 .
.
Build a story
You can create a new presentation based on the snapshots you took from the BI Analytics system.
Create a new story
To build a new story
Click
 .
.Select
 .
.Enter a title for the story.
Enter a description of your story.
If you want a cover image, click
 .
.
Open an existing story
Click
 .
.Click the story you want to open.
Add elements to your story
Once your story is created, you can add elements such as:
Snapshots
Text
Shapes
Images
To add a snapshot to the story
Click

to open the Snapshot menu.Drag a snapshot from the menu to the place you want it to appear on the slide.
(Optional) To select an alternative version of this snapshot, click

in the corner of the snapshot and select another version from the list.(Optional) To resize the snapshot, hover the mouse over its corners and drag to the desired size.
To add a text to the story
Click

to open the Text menu.Drag a text object from the menu to the place you want it to appear on the slide.
Double-click inside the text box.
Enter your text.
(Optional) To edit or format the text, click
 .
.(Optional) To resize the text, hover the mouse over its corners and drag to the desired size.
To add a shape to the story
Click

to open the Shape menuDrag a shape from the menu to the place you want it to appear on the slide.
(Optional) To select an alternative color for the shape, click the drop-down arrow in the top-right corner of the shape.
(Optional) To resize the shape, hover the mouse over its corners and drag to the desired size.
To add an image to the story
Click
 to open the Image menu
Drag an image from the menu to the place you want it to appear on the slide.
(Optional) To select an alternative color for the shape, click the drop-down arrow in the top-right corner of the shape.
(Optional) To resize the image, hover the mouse over its corners and drag to the desired size.
Embed a full sheet in your story
You can add a snapshot of a full sheet to your story. This snapshot includes a link to the sheet with the same filters as the snapshot. This provides a convenient way to jump between your story and the updated data in BI Analytics.
To add a full sheet to a story
On the bottom-left corner of the Story page, click
 .
.Suggest one of the options for the new slide that includes a sheet.
Click Select sheet.
Select the sheet you want to embed. Ensure that the sheets filters are configured to display the data you want to present on this slide.
(Optional) To access and modify the data in the embedded sheet, click Go to sheet. The sheet opens with the saved filters applied.
To return to the story, click Return.
(Optional)T o remove the embedded sheet from the slide, click
 .
.
Preview your story
From within the story, click  .
.
Use the arrows that appear when you hover the mouse over the sides of the window to navigate to the next or previous slide.
To close the preview, click  .
.
Export to PowerPoint
From within the story, click
 .
.Select Export a story to PowerPoint.
(Optional) Change the slide size and resolution to fit your needs.
Click Export