Each type of chart available in BI Analytics contains options that allow you to customize the way it displays its data. Certain options are available for specific chart types, and certain options are available in all charts. For example, the color modification options are available for all chart types.
Please note:
Changes made to your charts are only visible for the remainder of the session. The next time you access BI Analytics, the chart reverts to its default display settings. To permanently change a chart's display, contact your account manager.
For general information on BI Analytics, see BI Analytics.
For information on filtering data in BI Analytics, see Filter BI Data.
For information on creating dynamic presentations of your BI data, see BI Analytics Presentations.
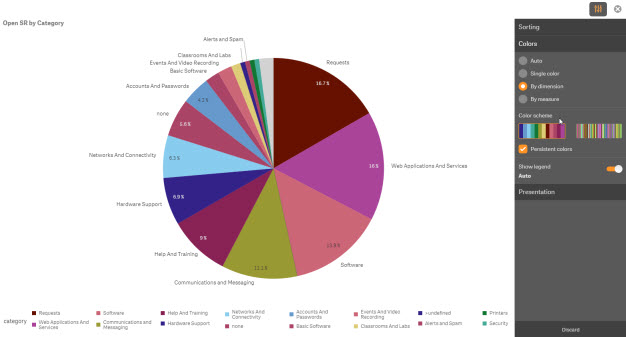
To modify a chart's color display
Hover over the chart and click
 .
.Select a color option.
(Optional) If you select to vary the color based on data:
Select a color scheme. You can choose between a color scheme containing 12 colors or 100 colors.
Please note:
People with color vision deficiency can differentiate between all of the colors in the 12-color option, but not all of the colors in the 100-color option.
If the option to display persistent colors in the chart is available, select the Persistent colors check box.
Use the show legend slider to determine if the chart includes a legend indicating what each color item corresponds to.
(Optional) To cancel your selections, click Discard.
Pie chart
Chart Position
You can rotate a pie chart to better read certain labels.
To rotate a chart, hover over it and use the the Scroll wheel on your mouse.
Another way to arrange the position of the chart is to select how the pie chart is sorted.
To sort a pie chart by one of its relevant fieldsHover over the chart and click
 .
.In the Sorting menu select the field you want to sort by.
Select to sort the chart in Ascending or Descending order.
(Optional) To cancel your selections, click Discard.
Modify chart format
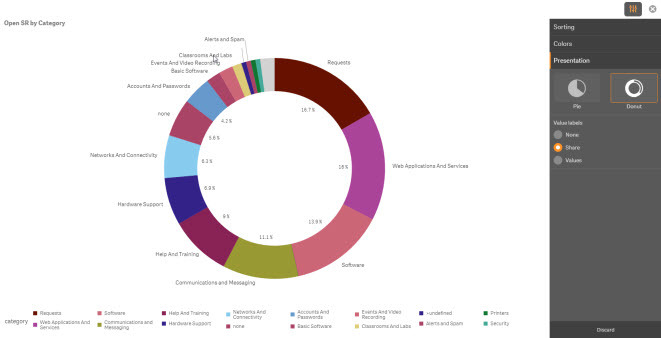
You can select to display your chart in Pie or Donut format.
To modify the chart's format
Hover over the chart and click
 .
.In the Presentation menu select Pie or Donut.
(Optional) To cancel your selections, click Discard.
Modify chart labels
You can select if you want the sections of your chart labeled and how to label them.
To modify the chart's labels
Hover over the chart and click
 .
.In the Presentation menu select one of the following Label options:
None - Do not label chart sections.
Share - Label each section with the percent of the chart it represents
Values - Label each section with the total number of items it represents.
(Optional) To cancel your selections, click Discard.
At any point you can return to Sheet view, by clicking .
.
Modify chart dimensions
Certain charts allow you to modify the dimensions that the chart displays
To modify the chart's dimensions
Hover over the chart and click
 .
.In the Dimensions menu select the dimension you want the chart to display.
(Optional) To cancel your selections, click Discard.
Bar chart
If a bar chart is too big to display entirely in its allotted space on the sheet, you can click and drag within the chart to scroll vertically or horizontally.
Sort
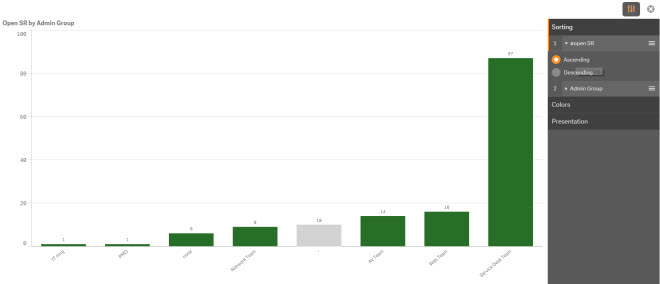
You can determine the order that the bars appear by selecting the sort method for the chart.
Hover over the chart and click
 .
.In the Sorting menu select the field you want to sort by.
Select to sort the chart in Ascending or Descending order.
(Optional) To cancel your selections, click Discard.
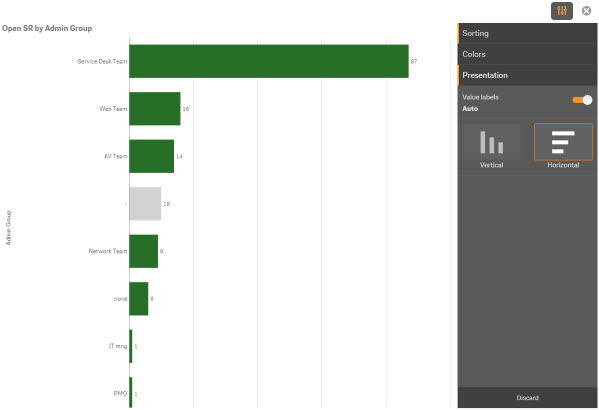
Modify chart format
You can select to display your chart in with vertical or horizontal bars.
To modify the chart's format
Hover over the chart and click
 .
.In the Presentation menu select Vertical or Horizontal.
(Optional) To cancel your selections, click Discard.
Add or remove chart labels
You can select if you want to label the bars in your chart.
To add or remove the chart's labels
Hover over the chart and click
 .
.In the Presentation menu click the Value labels slider to enable or disable chart labels for each bar.
(Optional) To cancel your selections, click Discard.
Open SR Overview chart
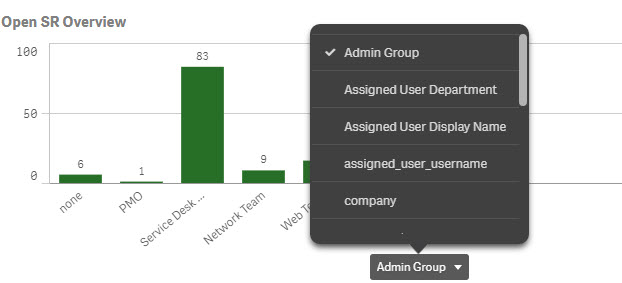
The Open SR Overview chart, located in the Currently Active SRs Overview sheet, is unique in that it allows you to select what field you want to measure in your open SRs.
To select a field
Click the drop-down menu beneath the chart.
Select an SR field.
Line chart
If a line chart is too big to display entirely in its allotted space on the sheet, you can click and drag within the chart to scroll vertically or horizontally.
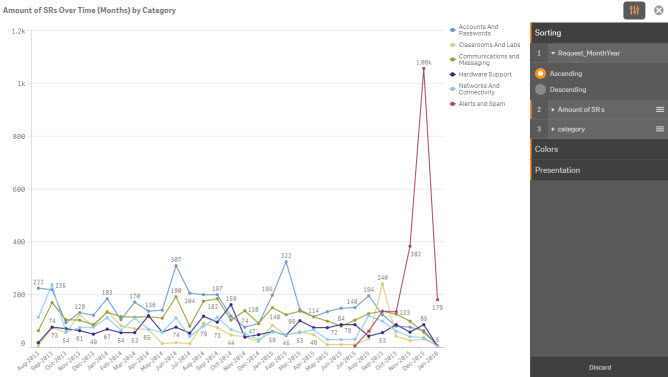
Sort
You can determine the order that the lines appear by selecting the sort method for the chart.
Hover over the chart and click
 .
.In the Sorting menu select the field you want to sort by.
Select to sort the chart in Ascending or Descending order.
(Optional) To cancel your selections, click Discard .
Modify chart format
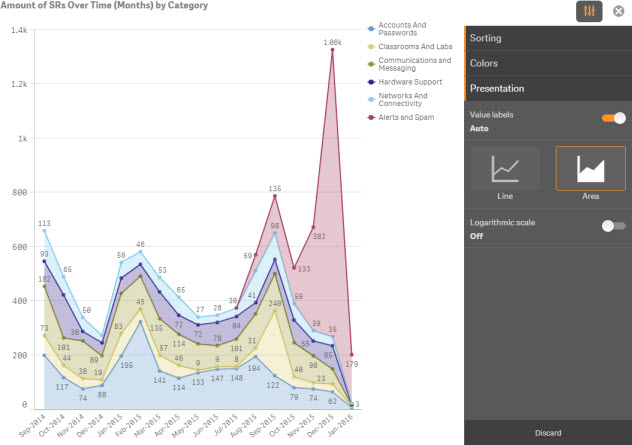
You can select to display your chart data with lines or stacked areas.
To modify the chart's format
Hover over the chart and click
 .
.In the Presentation menu select Line or Area.
(Optional) Click the Logarithmic scale slider to enable or disable Logarithmic scale in the chart's display.
(Optional) To cancel your selections, click Discard.
Add or remove chart labels
You can select if you want to label the points in your chart.
To add or remove the chart's labels
Hover over the chart and click
 .
.In the Presentation menu click the Value labels slider to enable or disable chart labels for each point in your chart's lines or areas.
(Optional) To cancel your selections, click Discard.
Scatter plot chart
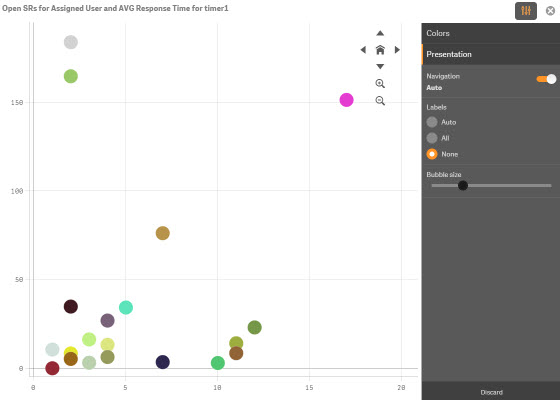
When you are viewing a scatter plot chart in the sheet, you can hover over the chart and use your mouse's scroll wheel to zoom in and out on the chart. Click and drag the chart view the areas that you want. When you are viewing the chart in Full Screen mode, you can also use the Zoom in and Zoom out buttons and the navigation arrows if Navigation is enabled.
To enable/disable the Navigation buttons
In Full Screen mode, click
 .
.Click the Navigation slider.
(Optional) To cancel your selections, click Discard.
Add or remove chart labels
You can select if you want to label the dots in your chart.
To add or remove the chart's dots
Hover over the chart and click
 .
.In the Presentation menu select one of the following Label options:
Auto - Label some of the dots, based on the available space around the dot.
All - Label all of the dots regardless of the space around the dot.
None - label none oft he dots in the chart.
(Optional) To cancel your selections, click Discard.
Modify size of dots in the chart
The scatter plot chart displays data in the form of dots on the chart. You can set the precise size of the dots in the chart.
To modify the chart's dot size
Hover over the chart and click
 .
.In the Presentation menu click and drag the Bubble size slider until the dots reach the desired size.
(Optional) To cancel your selections, click Discard.
