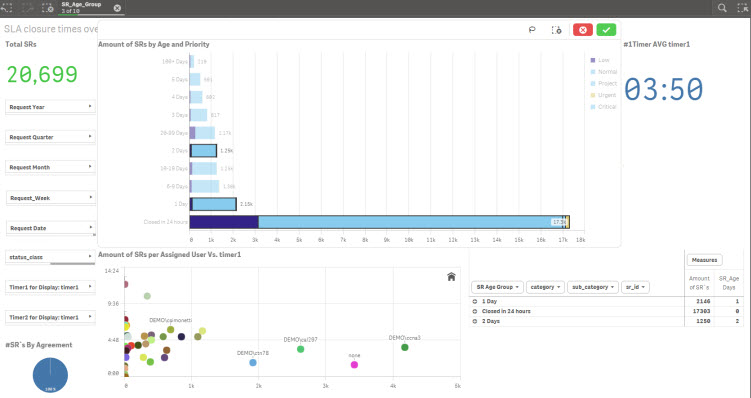
A sheet in BI Analytics displays multiple data points from your Help Desk. There are numerous ways for you to filter the data to zoom in and better understand and analyze existing information.
All selected filter items are displayed on the top of the sheet.
For general information on BI Analytics, see BI Analytics.
For information on the various graphs or charts available for displaying your data, see BI Analytics Chart Options.
For information on creating dynamic presentations of your BI data, see BI Analytics Presentations.

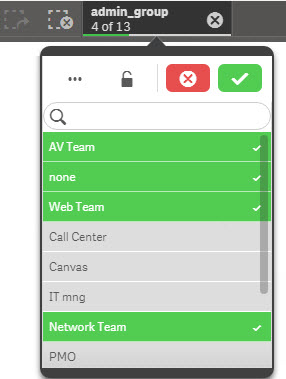
To edit a filter
Click on the filter in the top bar.
Click an item to select or deselect it.
(Optional) To search for field values, click inside the field's box.
(optional) To access filter options, click .
.(Optional) To select all of the values for a specific field, click in that field's box and click Select All.
(Optional) To select all possible values for a specific field, click in that field's box and click Select Possible.
(Optional) To lock the filter for further editing, click  . To unlock the filter, click
  .
.
Click
 to confirm your selection.
(Optional) To cancel your selection, click  .
.
(Optional) To cancel your selection and remove the focus from the chart, click  .
.

Select a filter entity from a chart
Perhaps the simplest way to filter your data is to select an entity from one of the charts on your screen.
For example, if you have a chart that displays the top SR categories, clicking on the items that represents specific categories filters all of the data by that category.
To select filters
Click the entities in a chart to highlight them and adjust the data in the other charts and objects on the sheet.
Click
 to confirm your selection.
(Optional) To cancel your selection, click .
.
(Optional) To cancel your selection and remove the focus from the chart, click .
.
BI Analytics filtered by time to close

By multiple Chart Entities
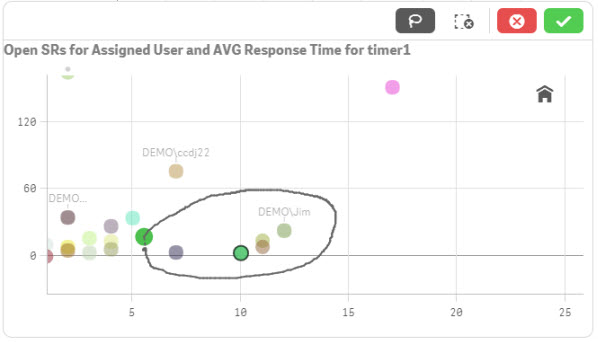
You can use the lasso or chart range methods to simultaneously select multiple entities on a chart for filtering your data. When you select multiple entities they appear on the top of the screen as a single filter selection.
To select multiple entities with lasso selection
Click the area of the chart you want to select items from.
From the chart's menu, click
 .
.Click and drag the curser over or around the items you want to include in your filter.
Click
 to confirm your selection. (Optional) To cancel your selection, click
  .
.
(Optional) To cancel your selection and remove the focus from the chart, click .
.

To select items on a chart within a set range
Click and drag along the axis of the chart to create a range for selection. Any items within that range are selected.
If you want to expand or decrease the range, hover your mouse over one of the edges, click and drag in the direction you want.
If you want to move the range, click and drag within the green area until the range covers the items you want to select.
Click
 to confirm your selection.
(Optional) To cancel your selection, click  .
.
(Optional) To cancel your selection and remove the focus from the chart, click  .
.

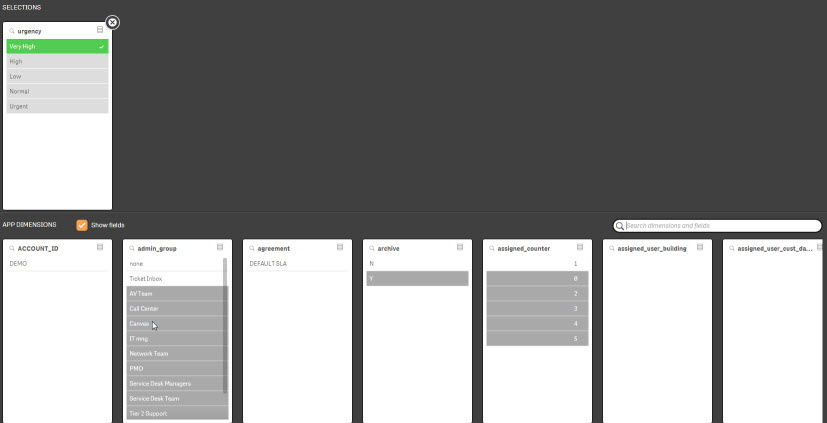
By SR field values
You can filter your data by any field in your help desk even if that field is not visually represented on any of your BI Analytics sheets. By default the Currently Active SRs Overview sheet is filtered by the Open SR status class.
To filter by a field value
In the top-right corner of the screen, click
 .
.Locate the field and click the values you want to include in the filter.
(Optional) To search for field values, click inside the field's box.
(Optional) To select all of the values for a specific field, click in that field's box and click Select All.
(Optional) To select all possible values for a specific field, click in that field's box and click Select Possible.Click to confirm your selection
 .
.
(Optional) To cancel your selection, click .
.
(Optional) To cancel your selection and remove the focus from the chart, click .
.When you have selected the values you want for the field, in the top-right corner of the screen, click
 .
.

By SR Type
You can filter the Incidents vs. Requests Dashboard (Sheet 2) — so that it only shows one of the two Service Record Types.