Uncover the potential of your Service Desk data using the Qlik Sense platform. Enjoy more robust capabilities so you can leverage every metric and trend identified in the BI Analytics Dashboards.
Requirements
SysAid Service Desk
BI Analytics Access permission
Email address defined in SysAid
SysAid’s BI Analytics module, integrated with the Qlik Sense platform, empowers you to efficiently extract insights from your Help Desk data (over the last 36 months).
Admins with BI Analytics Access permissions can pose queries that target trend detection within their organization. This tool facilitates in-depth examination of Service Requests (SRs) and Administrators, offering customizable charts and graphs for streamlined data visualization.
This model is a Cloud-based solution — but is also available in Hybrid mode for On-Premise installations (see below for more details).
How BI Analytics works
BI Analytics uses Single Sign On to log you into the Qlik Dashboard (applies to Cloud accounts only).
SysAid runs a collection process every hour that collects different tickets that have been added/updated/deleted.
This allows your BI Analytics Dashboard to be fully synced with your Service Desk’s processes and to give an accurate representation of its progress.
BI Analytics Dashboard Update Intervals:
The BI Analytics Dashboard is updated in three hour intervals.
Enable browser access
Accessing SysAid’s Qlik-hosted BI Analytics Dashboard on your browser requires:
Third Party Cookies allowed
Pop-up blocker disabled
Email defined in SysAid
Allow Third-party cookies
Viewing the BI Analytics Dashboard requires allowing Third-party cookies for both the:
BI Analytics page (when clicking from the Analytics menu in SysAid)
Qlik BI portal (on the Qlik Cloud page)
To make sure Third-party cookies are enabled for both pages, open each page in Google Chrome and follow these steps:
Click the 3-dot menu on the right side of the address bar.
Select Settings.
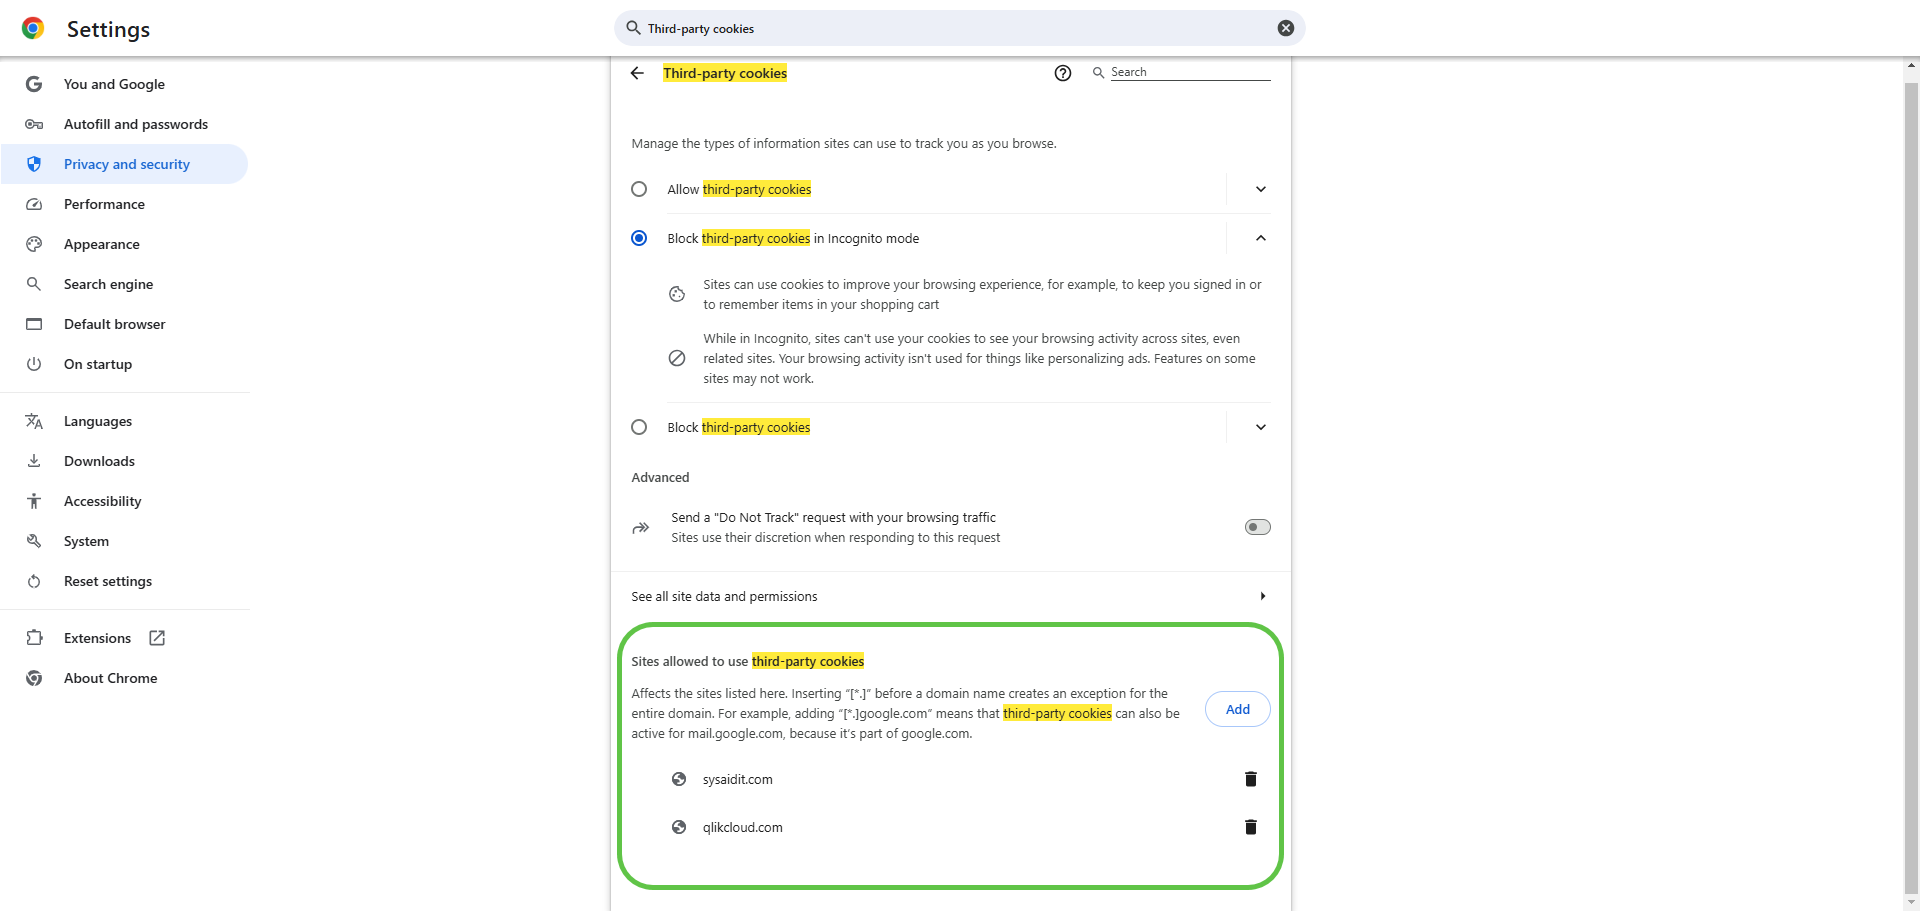
Write Third-party cookies in the search bar on top.
Choose the highlighted Third-party cookies option.
Under the Sites allowed to use third-party cookies, click Add.
In the Site field, enter qlikcloud.com and click Add.
Repeat steps 5 and 6, but this time enter sysaidit.com in the Site field.

That’s it! You’re done.
Disable Pop-up Blocker
The Pop-up blocker must be disabled for your Service Desk.
To disable the Pop-up blocker in Google Chrome, follow these steps:
Click the 3-dot menu on the right side of the address bar.
Select Settings.
Write Site settings in the search bar on top.
Choose the highlighted Site settings option.
Select Pop-ups and redirects, go to Allowed to send pop-ups and use redirects.
Click Add.
In the Site field, enter your SysAid Server URL.
Tip:
You can find you SysAid URL in your sysAid account under Help > Account Info.
Click Add.
That’s it! You’re done.
Grant BI Analytics permission

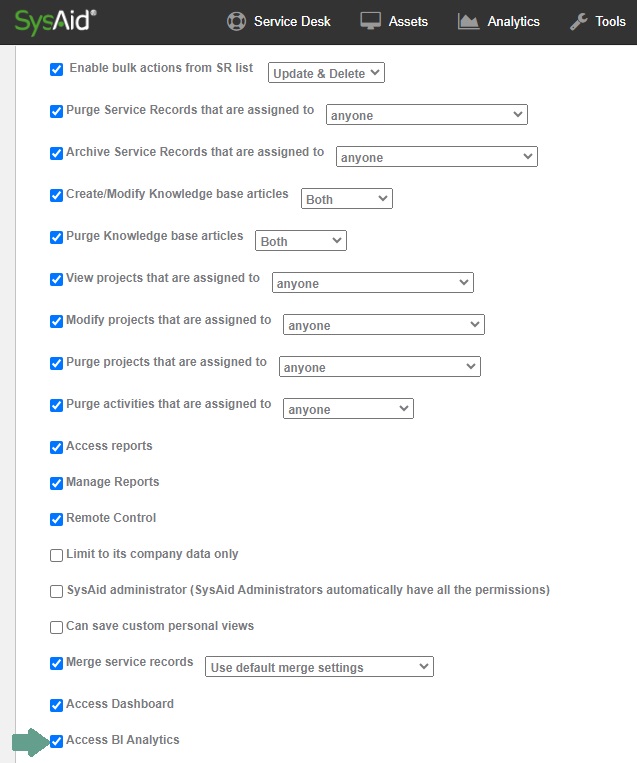
To grant Admin access to BI Analytics from the Service Desk, go to Tools > User Management > Administrators and click on the relevant Admin.
Go to the Admin record’s “Permissions” tab, and check off “Access BI Analytics”.
BI Analytics access can also be granted to an entire Group — in User Management Settings.
To grant BI Analytics access to a Group:
Go to Settings > User Management > Groups.
Make sure the Enable group permissions checkbox is selected.
Select the Access BI Analytics checkbox.
Click Save.
Learn more about Group permissions
Inside the Dashboard
.jpg)
Sheets
The data in BI Analytics is displayed across several screens called "Sheets".
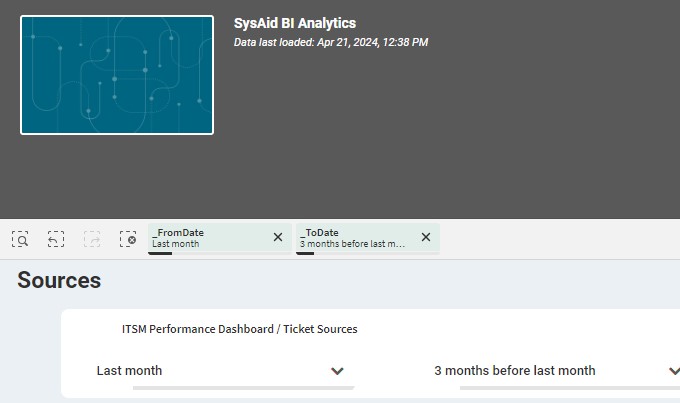
The default BI Analytics Dashboard is the “ITSM Performance” Sheet; this loads upon opening the BI Analytics Dashboard.
The ITSM Performance Dashboard’s default comparison time frame measures how many Closed Service Records there were in the previous month – compared to how many Closed Service Records there were during the three months before that month.
Admins can customize the Dashboard to show any date range; four data widgets are found inside the Dashboard – each of which drills down to metrics that compare specific variables to identify trends.
Admins with SysAid Copilot Licence can monitor the adoption of AI Chatbot Service Record creation by end users.
Tickets Closed per Month:
To identify the number of tickets that were “Closed” per month, (measured according to the Ticket Source):
This data is generated by calculating the Tickets whose Status Field value was “Closed” with the Source Field value, and groups the calculation according to months.
Navigate between Sheets
When viewing a Dashboard other than the default “ITSM Performance”, Admins can navigate back to this original Dashboard by clicking the initial breadcrumb (root) on the breadcrumb trail – where it says “ITSM Performance Dashboard”.
These Dashboards include:
ITSM Performance Dashboard (Default)
Incidents vs. Requests
Efficiency Indicator: Handoffs
SLA Indicator: Resolution Time
Ticket Sources
Active Service Records (SRs)
To navigate sequentially between each Sheet, use the Forward and Back arrows to navigate to the next or previous sheet.
To navigate between the Dashboard Sheet options (to skip to the relevant Dashboard), click on the “Sheets” dropdown menu and once the window expands, click on your desired Sheet.
For information on customizing a sheet or creating a new sheet, contact your Account Manager.
Charts
You can get a better look at a chart by viewing it in full-screen mode.
To expand a chart
Hover your mouse over the chart and click
 .
.To exit full screen mode, click
 .
.
Bookmarks
You can bookmark sets of Sheet Filters for filtered data that may be relevant for measurement/analysis in the future.
Create a bookmark
When you have selected the filters you want to save, click
 .
.Click Create new bookmark.
Enter a title and description for your bookmark.
Click outside of the gray area.
View Bookmark properties
You can view a bookmark's description and filters to determine if you want to open that bookmark.
Click
 .
.Click the
 corresponding to the bookmark you want to view properties for.
Edit bookmark properties
Click
 .
.Click the

corresponding to the bookmark you want to edit properties for.Click
 .
.Edit the bookmark's title and/or description.
click
 .
.
Delete a bookmark
Click
 .
.Click the
 corresponding to the bookmark you want to delete.
Click
 .
.Click
 .
.
Metadata fields
Each Analytics Dashboard displays when the Dashboard data was last loaded. This knowledge allows you to know how up-to-date the Dashboard content is.
