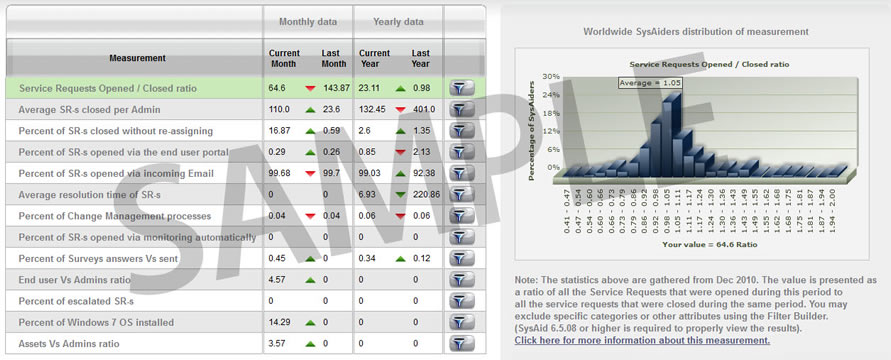
With IT Benchmarks, you can instantly compare the performance of your IT department to the performance of IT departments around the world. You can view performance ratios for your company versus other companies, and you can set goals to help you beat the industry average for these ratios. IT Benchmark will not share any information that can be used to identify your company.
Ratios are updated automatically, once a day.

Measurement details
On the left side of the screen you can see a table with several dynamic IT measurements. When you click one of the measurements, the two graphs on the right of the screen and the measurement description will display data for that measurement.
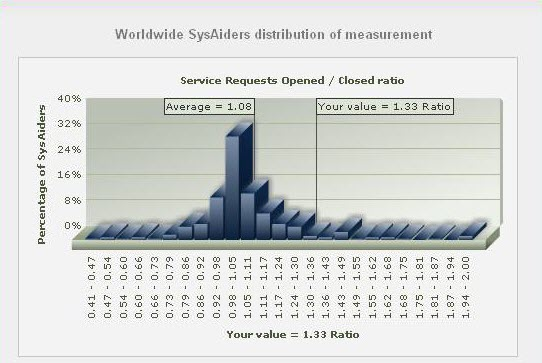
The top graph shows worldwide values for the chosen measurement, collected from the SysAids of real IT professionals such as you. The graph also shows where your help desk ranks for the chosen measurement. The bottom graph shows a history of the results of the measurement for your help desk.
Here is a sample graph of "Open/Closed service records ratio" worldwide, including the local helpdesk value:
"Open/Closed service records ratio" graph

Between the top and the bottom graphs on the right side, you will see an explanation of the chosen measurement. You may access more detailed information for the measurement by following the link at the end of the text.
Creating a filter
The filter icons  located next to each measurement allow you to include only certain data in a particular measurement. For example, you might choose to exclude your part time admins from the "Average SR-s closed per Admin." ratio.
Click the filter icon next to the measurement you wish to create a filter for and follow these directions for using the Expression Builder. After creating the filter and closing the Expression Builder, click the Save and update statistics button to save the new filter. If you do not save the filter, it will be lost when you leave the page.
Once you save the changes, choose whether or not to recalculate the statistics immediately using your new filter (as opposed to waiting until the end of the day).