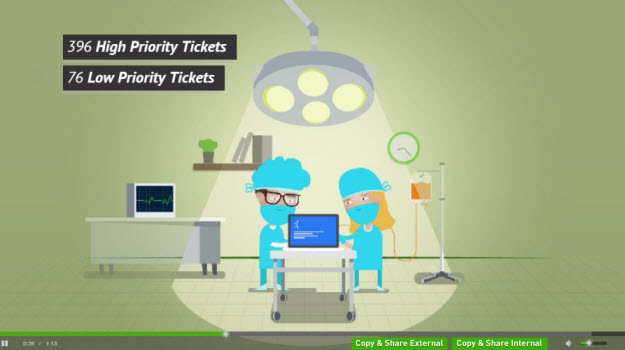
SysAid now provides a new and innovative way to display your Help Desk statistics. You can create a fun animated video summary that displays the following basic IT statistics over a given period of time:
- Number of service records
- Number of high priority tickets
- Number of low priority tickets
- Busiest day of the week
- Busiest hour of the day
- Most active admin (based on number of tickets handled)
- Most active end user (based on number of tickets opened)
- Number of incidents
- Number of requests
- Number of changes
- Number of problems
You can then create a link to the video to be viewed by your coworkers or customers.
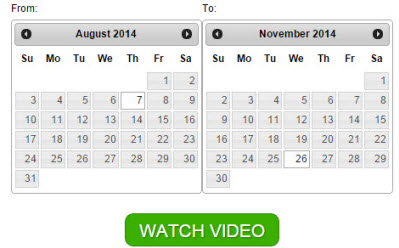
To create and play the animated summary video
- Use the date pickers to select the time frame you want to summarize.
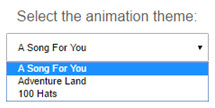
- Select the video's theme theme from the Animation Theme drop-down.
- Click Watch Video.
Share your video
To share your video with people who have access to your server, click Copy & Share Internal.
To share your video with people outside of your server's network, click Copy & Share External.
The text of the link is copied to your clipboard for you to paste in an email or anywhere you want.