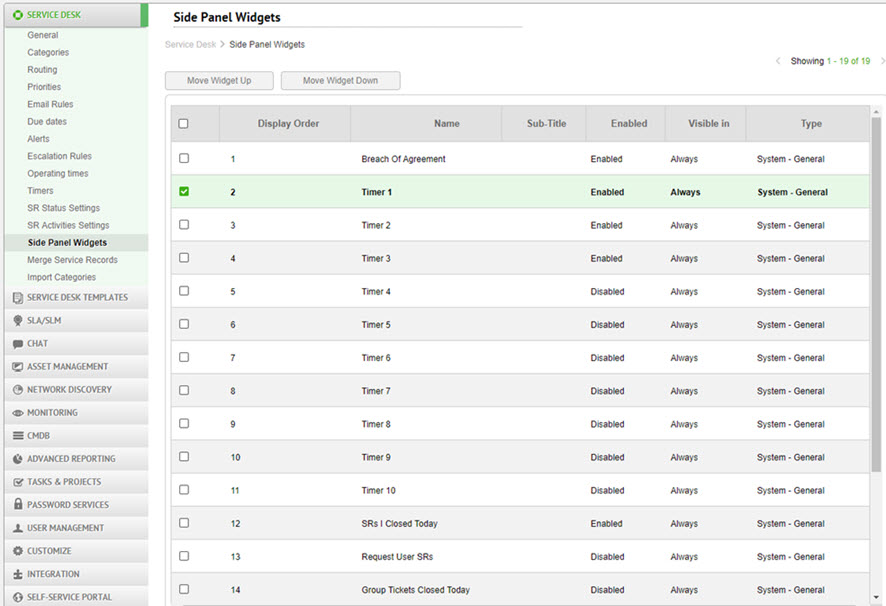
The insights panel in the SR form displays graphic measurements that provide relevant information about the logged-in admin and/or the current SR. This page allows you to determine which charts are displayed in the panel and how they are displayed.
To display a widget in the SR form's insights panel, click the widget's row to open it's form.
To change the order in which widget's are displayed in the Insights Panel
- Select a widget's check box.
- Click Move Widget Up or Move Widget Down until the widget is in the desired position.

Available widgets
The following widgets are available out-of-the box.
If you click on either of the segments of the donut chart, the relevant list displays up to 40 items.
Field Name | Description |
|---|---|
SRs I Closed Today | Displays the number of SRs you closed today. The donut chart compares that number with the number of your active SRs. This allows for easy access to you open and closed SR queues. |
Current SR Group Recent Actions | Displays the number of SRs assigned to the same group as the current SR, that were closed today. The donut chart compares that number with the number of the group's active SRs. This allows for easy access to your groups, open and closed SR queues. |
Request Users SRs | Displays the number of all the open SRs requested by the request user of the current SR. The donut chart compares that number with the number of SRs requested by that user that were closed in the past 30 days. This widget provides easy access to all of the request user's SRs. Some of the SRs may contain relevant information for resolving the current SR. |
| Similar SRs (Admin by Category) | Displays the number of SRs with the same category as the current SR that were submitted in the past seven days. The donut chart divideds the SRs by their assigned admins. This could help provide a big-picture look at which admins may have experience with the issue you are trying to resolve. |
Similar SRs (by Sub Category) | Displays the number of SRs with the same sub-category as the current SR that were submitted in the past seven days. The donut chart divideds the SRs by their assigned admins. This could help provide a more detailed look at which admins may have experience with the issue you are trying to resolve. |
Timer 1 | By default this timer is for Time to Repair. The widget displays the the current SRs timer value. The donut chart compares this number with the average value of this timer for SRs with the same category from the past 30 days. This could provide a relevant measurement of how you're progressing in resolving the SR. |
Timer 2 | By default this timer is for Time to Respond. The widget displays the the current SRs timer value. The donut chart compares this number with the average value of this timer for SRs with the same category from the past 30 days. This could provide a relevant method for measuring your response time for the SR. |
Breach of Agreement | Displays the number of SRs approaching their defined due dates. The donut chart divides the SRs by time remaining until the due date. This can help you determine the order in which you resolve your SRs, based on the amount of time you have left until their due dates. |
My Active SRs by Priority | Displays the number of SRs assigned to you. The donut chart divides the SRs by priority. This can help you determine the order in which you resolve your SRs, based on the their priority. |
Unassigned SRs | Displays the number of all the SRs that have been assigned to one of your groups, but not to a specific admin. The donut chart divides the SRs by assigned group. This can help you ensure that unassigned SRs are not forgotten. |
Recently Modified Software Products | Displays the number of software changes made on the request user's asset in the 48 hours before the current SR was submitted. The donut chart compares this number to the number of changes made since the SR was submitted. This can provide a picture of the recent changes in the user's system and allows you to potentially find relevant data for locating the source of the issue and/or resolving the SR. |
Relevant KB | Displays the number of knowledge base articles that have the same category as the current SR. This allows admins who open an SR to easily access a list of knowledge base articles with the same category to check if any of them contain information that could be helpful in resolving the SR. |