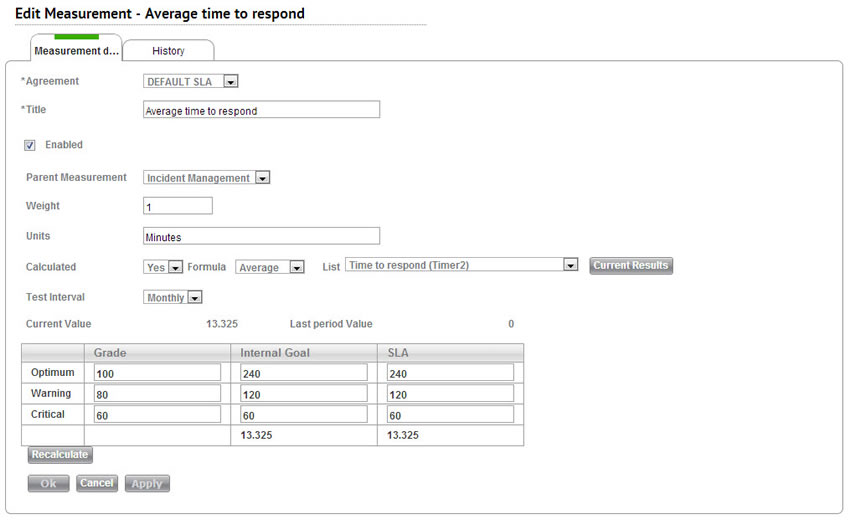
This page allows you to create new measurements for your SLA. Following is an explanation of each field on this page. Click OK or Apply when you've finished to save your work.
If you have not already, please read our measurements overview to understand how this screen fits into the other components of SLA.

Agreement: Determines which service records will be included in this measurement. Only service records part of the SLA specified here will be included in the measurement.
Please note that only service records created after you've enabled the SLA/SLM module will have an attached agreement and be included in measurements.
Title: The title of this measurement.
Enabled: Determines whether this measurement will be calculated. Calculation is automatically done once a day.
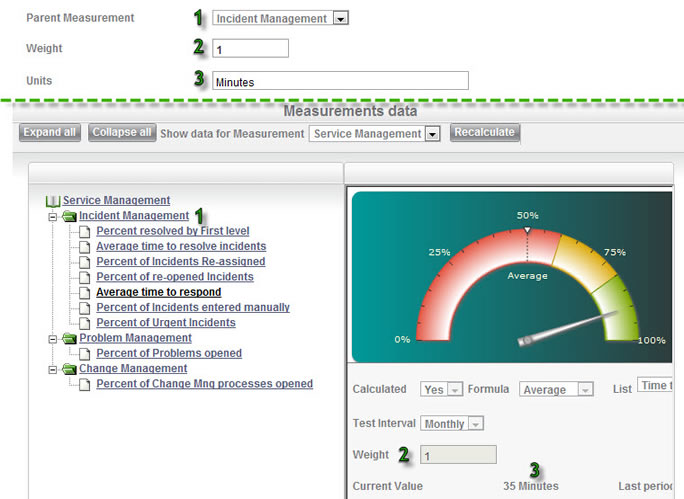
The following three items reference the screenshot below. The bottom portion of the screenshot is from Analytics > SLA/SLM > Service Management.
Parent Measurement: The folder that this measurement sits in on the Service Management Dashboard. If you do not choose a parent measurement, this measurement will become the first item on a new page, selectable from the Show data for Measurement drop-down list.
Weight: The number of times this measurement is counted when generating the average for a non-calculated parent measurement (see calculated vs. non-calculated below). For example, a non-calculated parent measurement has 4 children, three of which have a weight of 1 and one of which has a weight of 2. The average shown when you click on the parent measurement is as follows: the three measurements with a weight of 1 each comprise 20% of the average for a total of 60%, and the one measurement with a weight of 2 comprises 40%.
Units: The unit of this measurement. As you can see in the screenshot, the units for the average time to respond list is minutes.

Calculated: If a measurement is calculated, it is performing a specific calculation (Formula ) on a specific dataset (List ) (see screenshot below).
The possible formulas are:
- Average: Adds up the data values from the list and divides by the number of data values.
- Minimum: Displays the lowest data value from the list.
- Maximum: Displays the highest data value from the list.
- Count: Presents the number of data values in the list. Note that this formula ignores the values of the data entries and just counts the number of entries. (e.g. the list has 3 values: 5, 7, and 20. This formula will return 3, the number of values in the list).
- Sum: Presents the sum of all data values in the list.
- Ratio: This formula will ask you for two lists. It will use the Count formula on each list, and then present the ratio of the number of items in the first list to the number of items in the second list. This formula will return a percentage.
The lists are created by you under Settings > SLA/SLM > Measurement Lists .
As an example, the measurement in the top part of the screenshot below calculates the average value for the Time to respond list. You can view this list under Settings > SLA/SLM > Measurement Lists. You can view the results of the calculation under Current value (see below).
If you would like, you can click on Current Results to see the current values in the selected list.
Non-Calculated: If a measurement is non-calculated, it will show an average of the grades (not the measurement values) of all child measurements. For example, the Incident Management measurement is non-calculated. It has 8 child measurements (see screenshot above). Once SysAid has calculated the grades for these 8 measurements, it will add the grades together and divide by 8. It will show the results under the Incident Management measurement. If you would like, you can give a child measurement a higher weight (see above), and then it will be counted multiple times for this measurement.

Test Interval: How far back in time to go when measuring the dataset. For example, a monthly test interval will only look at data values collected since the first day of the current month.
Current Value: The result of the calculation.
Last Period Value: The result of the calculation for the previous test interval. If, for example, the test interval were monthly, this would show the previous month's data.
Recalculate: Update current and last period values using the current list data. Recalculation is done automatically on a daily basis, so there is usually no reason to use this button.
Internal Goals and SLAs: These fields represent your performance targets. The SLA fields should include your targets as specified by your SLA, and the internal goals should represent more aggressive, internal performance goals. The values in these fields should be in the same format as the Current value . For example, if you are measuring average time to respond (in milliseconds), the numbers in these fields should be the optimum, warning, and critical time to respond, also in milliseconds. The numbers in gray at the bottom of these two columns are the grade for the SLA and internal goal, respectively.
Grades: These are your Optimum, Warning, and Critical grades. Typically, grades will be on a scale of 1 - 100, with 100 being optimum and 1 meaning that the helpdesk is not doing any work. You can change these numbers to use whatever scale you like (i.e. 1 - 10).