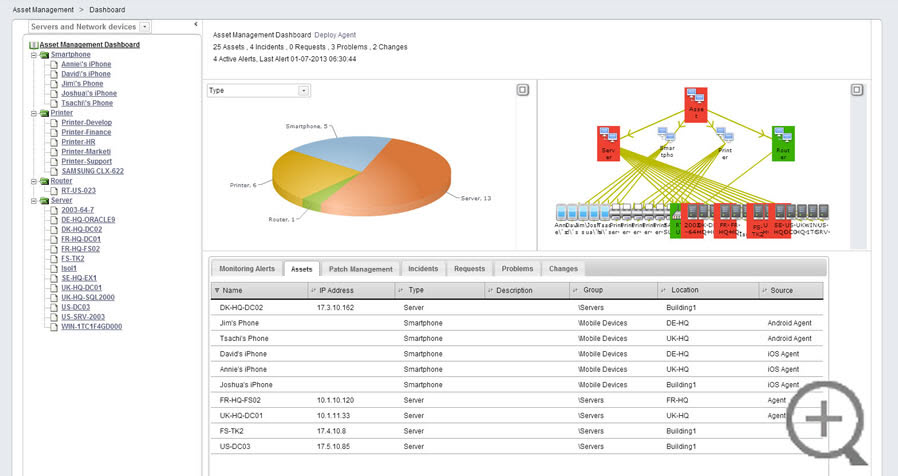
The SysAid Asset Management Dashboard gives you a birds-eye view of your asset inventory. View assets by type, location, department, and more. The Dashboard includes a sortable asset tree, various asset overview charts, and a list of monitoring alerts and service records affecting your assets.
Click the expand icon  next to any chart to open a full screen version of that chart.
Use the Asset Tree
The asset tree, located on the left side of the Dashboard, allows you to group assets for purposes of the various charts and graphs that the Dashboard offers you. The asset tree supports two levels of grouping. For example, if were to group by location and then type, you would see a first level grouping with all of your different locations, and then each location would show assets at that location, sorted by type. Using this view, you could easily see all monitoring alerts and service records related to the printers located at your company headquarters.
Select an Asset or Group
You can click on any asset group to view charts and graphs for that group. You can click on any individual asset to view CMDB, monitoring, Patch Management, and SR information for that asset.
Change the View
The Default view for the asset tree shows servers, printers, and SNMP devices sorted by type. You can change to a different view by selecting the desired view from the drop-down list above the asset tree. Read below to learn how to create new views.
Hiding the Asset Tree
If you would like more space on your screen to view the Dashboard charts and graphs, you can click the < icon to the right of the View drop-down list to hide the asset tree. Click > to show the asset tree again.
Click to hide the asset tree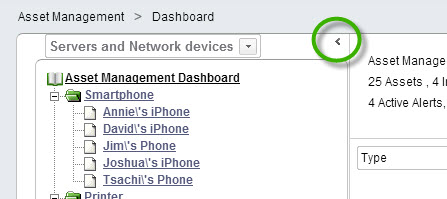
Create and Edit Views for the Asset Tree
Because the content of Dashboard charts and graphs depends upon your asset groupings, it's important to create appropriate groupings for your assets.
To create a new view for the asset tree:
- From the drop-down list above the tree, select Edit. This opens the Edit View box.
- select Please enter a name for the new view: and type your desired name in the adjoining text box.
- Select the primary and secondary groupings for your assets. For example, the primary grouping might be location, and the secondary grouping would be type. This would show you all the different assets of each type for each of your different locations.
- If you would like the tree to show only some assets, click on
 to open the Expression Builder where you can create a custom filter. For example, you could choose Department = Finance, and then only assets that are part of the finance group appear in the Asset tree.
 - Click Apply. This closes the Edit View box and creates your new view.
To modify an existing view:
- From the drop-down list above the tree, select Edit. This opens the Edit View box.
- Select Existing view: and select from the list the view you would like to edit. The selected view appears.
- Follows steps 3 - 5 for creating a new view, above.
View an Asset Grouping
Once you've grouped your assets appropriately, you can use the Dashboard to learn important information about your assets. From the asset tree, click on a grouping of assets. The right portion of the screen updates to show information about this asset grouping.
Viewing the Workstation asset grouping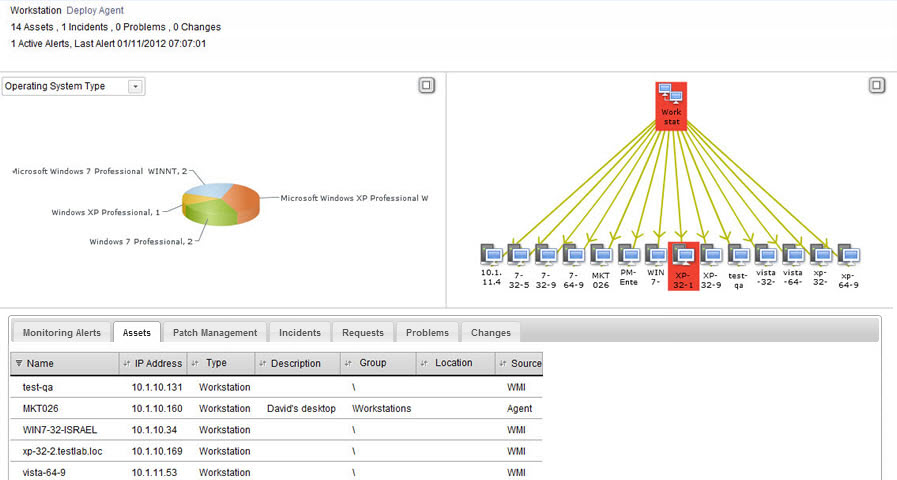
When viewing an asset grouping, you see the following:
Inventory Chart
The left-hand chart shows you the breakdown of assets in the grouping. For example, the chart in the screenshot above shows assets by asset type. To change the breakdown, select a new breakdown from the drop-down list. Other breakdowns include by location, by manufacturer, by Patch Management, and by operating system type.
Asset Hierarchy Chart
The right-hand chart displays your assets according to the groupings you've created in the asset tree. You can click on an asset and drag it around the screen if you like. Assets with a colored background indicated monitored assets. Green means that the monitoring status is normal, yellow means there's a warning, and red means that there's an error. The parent grouping takes on the color of the most severe monitoring alert within it.
Asset details
The bottom pane shows details for the assets in your grouping. Monitoring Alerts shows you any active alerts on any assets in the grouping. Assets shows you a list of the assets in the grouping (just like the asset list). Incidents, Requests, Problems, and Changes show you related service records on the Service Desk.
Deploy agent
Deploys the agent to all assets in the selected folder and any sub-folders. Note that the agent is only deployed in this manner to assets whose source is WMI.
View a Single Asset
The Asset Management Dashboard allows you to view information for individual assets as well. This information differs from what you see when you select an asset group. From the asset tree, click on a single asset. The right portion of the screen updates to show information about this asset.
Viewing a single computer, XP-32-1 (asset was imported by the Agent)
When viewing a single asset, you see the following:
Monitoring Chart
The left-hand chart shows you the CPU, memory, and hard drive use of the asset. To see this information, you must first create monitoring rules for the asset for these three performance measurements.
CI Relations Graph
The right-hand chart shows you the CI Relations graph for the selected asset. The graph shows CI relations in both directions: affecting on and affected by. Click on a CI to view details for that CI.
Asset Details
The bottom pane shows details for the selected asset. Monitoring Alerts shows you any active alerts on the asset. Assets shows you the asset entry as it appears in the asset list. Incidents, Requests, Problems, and Changes show you any attached service records on the Service Desk.
Deploy Agent
Deploys the agent to the selected asset. Note that the agent is only deployed if the asset's source is WMI. This option doesn't appear if the asset already has an agent installed on it.