AI Admins can receive weekly AI Insights emails (when SysAid Copilot is enabled).
AI Insights emails provide concise summaries (AI-generated) of key performance indicators (KPIs) and actionable insights, ensuring efficient data analysis without the need for manual report generation.
This document explains the content of the AI Insights email and its value for AI Admins looking to leverage generative AI capabilities for more impactful data analysis and educated decisions for improving performance.
The weekly AI Insights Email includes:
Key Performance Metrics
Dynamic Insights
Active Tickets Breakdown
Weekly delivery schedule
AI Admins receive this weekly email every Monday morning in their respective time zone.
This email equips recipients with comprehensive insights into their previous week's cumulative performance and strategic action items to enhance future performance for the upcoming work week.
AI-Generated Content Disclaimer
AI Insights are generated solely from KPI values; none of your data or Personally Identifiable Information (PII) is used to generate the report
Configure the AI Insights email
As an Admin, you can choose whether to enable the AI Insights email across your account for all your agents.
Once enabled, each agent can configure their AI Insights email to only include group data relevant to their needs. They can also add recipients so they receive the same customized email.
To configure your AI Insights email:
In SysAid Classic
In your account’s Self-Service Portal, go to the end-user-facing copilot.
Click Settings > General.
Click the AI Admin Assist dropdown.
Turn on the toggle to enable the feature across your SysAid account.
Check the Enable Insights Email for me checkbox.
Select the group data that will appear in your email. You must select at least one group.
Include additional recipients who will receive the same customized email.
In SysAid Spaces
Go to Settings > SysAid Copilot > General Settings.
Click the AI Admin Assist dropdown.
Turn on the toggle to enable the feature for all agents.
Check the Enable Insights email for me checkbox.
Select the group data that will appear in your email. You must select at least one group.
Include additional recipients who will receive the same customized email.
Your Weekly Summary

The “Your Weekly Summary” section measures the following metrics (by percentage) — within a Week-over-Two Weeks time frame.
Performance Summary | ||
|---|---|---|
Metric | Definition | Data Frequency |
MTTR (in days) | Total number of Closed Tickets (relevant to MTTR) | Weekly (Static) |
User Satisfaction Score | Response Rate (Number of Closed Tickets with a response) | |
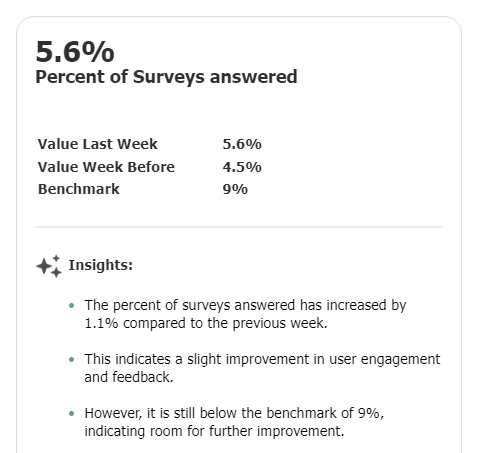
% of Surveys answered (Example) | # of Surveys answered | Dynamic per Week (AI-generated selection) |
% of Tickets received from the | # of Tickets received through the Self-Service Portal | |
Dynamic Metrics

“Well Done, Keep Crushing IT”
These AI Insights identify and elaborate on a KPI you’re doing well at.
This metric is a comparison (by percentage) of the successful KPI’s progress, comparing its performance to:
Last week’s value
Value the week before
Benchmark
Insights
This section’s KPI Insights elaborate on:
What the improvement percentages represent
What the performance increase indicates about the activity impacting the KPI
How the current performance relates to the benchmark
Benchmark KPI Collection:
SysAid Benchmark Data is based on over 200 customers with over 2 million Service Records.
Learn more about these KPIs in the Service Management KPI and Benchmark Forum on our Community
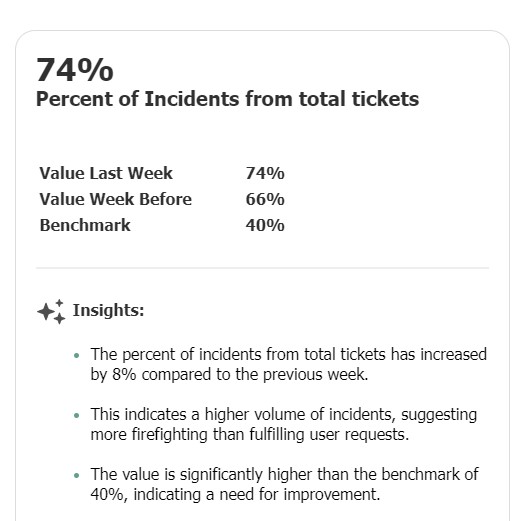
“Now, let’s improve this KPI”

These AI Insights identify and suggest improvements for a KPI you could improve.
This metric is a comparison (by percentage) of the KPI’s progress, comparing its performance to:
Last week’s value
Value the week before
Benchmark
Insights
This section’s KPI Insights elaborate on:
What the decrease in performance represents
How the current performance rate compare to the benchmark
Potential causes behind the decrease in performance
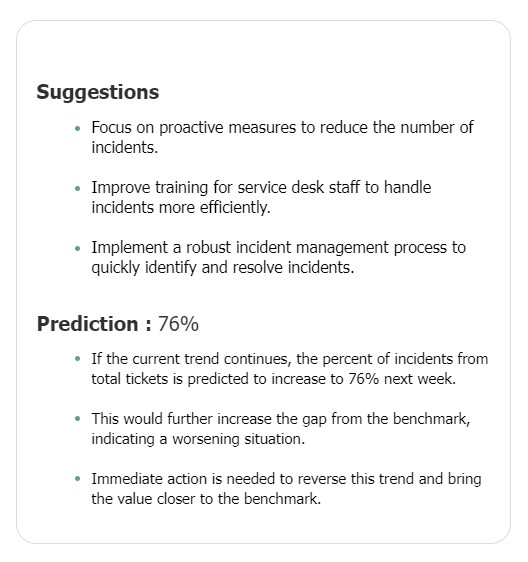
Suggestions and Predictions for the next 7 days

Suggestions
This section discusses the KPI you can improve, suggesting:
Definitive actions to take to improve the KPI and how to execute them
The goals and results that these actions could potentially achieve
Prediction
This section predicts and describes:
An increase in percentage for your KPI’s performance
How that figure compares to the benchmark
How the suggested improvements will allow the KPI performance percentage to increase
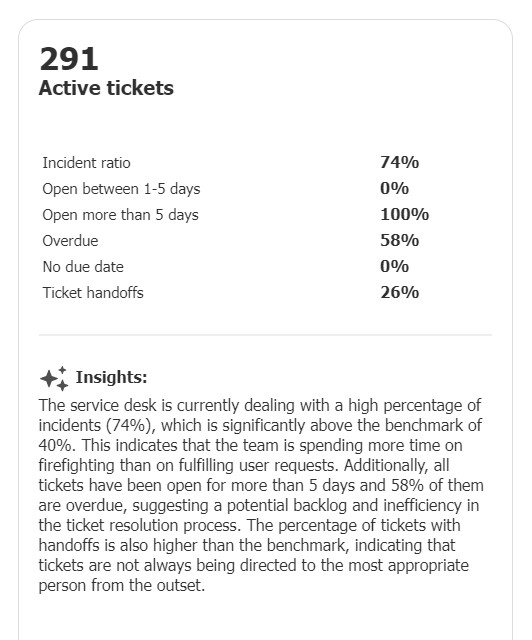
Active Tickets Breakdown

This segment categorizes and measures (by percentage) the AI Admin's Active Tickets based on various criteria:
Active Tickets by Percentage | |
|---|---|
Metric | Definition |
Incident Ratio | Ratio between number of Active Incident Tickets compared to number of Active Incident & Request Tickets |
Open for 1-5 days | Active Tickets that remained open for 1-5 days |
Open for 5+ days | Active Tickets that remained open for 5+ days |
Overdue | % of Active Overdue Tickets within all Active Tickets |
No Due Date | % of Active Tickets without a Due Date, within all Active Tickets |
Ticket Handoffs | % of Active Tickets that have been assigned to more than one Admin, within all Active Tickets |