Introduction
- 02 Jan 2023
- Print
- PDF
Introduction
- Updated on 02 Jan 2023
- Print
- PDF
Article summary
Did you find this summary helpful?
Thank you for your feedback!
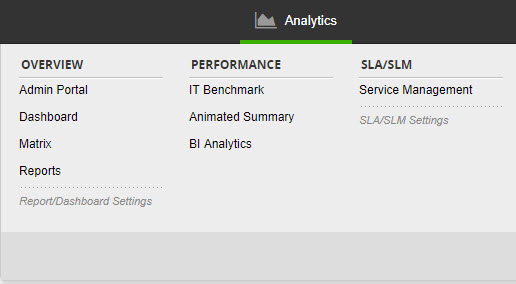
Analytics contains many tools that provide you with an overview of SysAid through various dashboards and reports. Following is a brief description of each sub menu and what it offers.
Admin Portal
Administrators can see who is logged in, how many service records are assigned to themselves, asset information, and more.
Dashboard
Access to real-time charts and graphs for a visual overview of SysAid.
Matrix
Easily see the distribution of service records, whether by status, administrator, urgency, or any other variable.
Reports Run reports to evaluate the performance of your help desk, track inventories, measure the progress of your various tasks and projects, and more.
IT Benchmarks
View your helpdesk's performance in a global IT context.
Animated Summary
Create a fun animated video summary that displays basic IT statistics over a given period of time.
BI Analytics
Use the Qlik Sense platform in your SysAid installation to perform an analysis that allows you to identify trends and outliers in your organization by asking pointed questions in a structured manner.
Service Management
Monitor your helpdesk performance vs. your SLAs.
For more information, open the Documenation for any of the individual analytics tools.
.png)