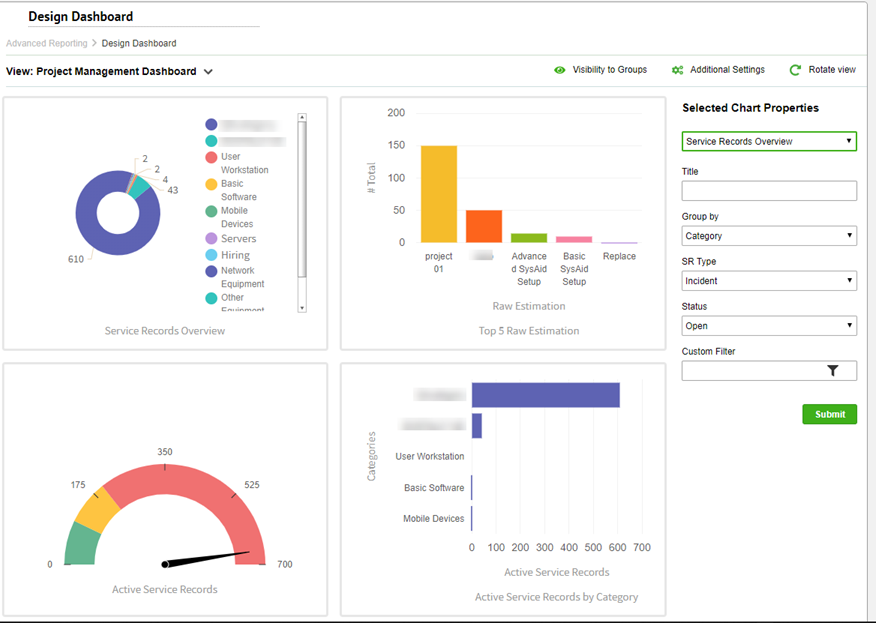
The Design Dashboard page allows you to choose:
- How many pages of charts appear in the Manager Dashboard
- Which charts appear on each page
- What those charts show
See below for a full list of charts available for the Manager Dashboard.

Adding views to the Dashboard
Each page in the Manager Dashboard is called a view, and can contain four or six charts/graphs. You can create as many views as you like.
To create a view
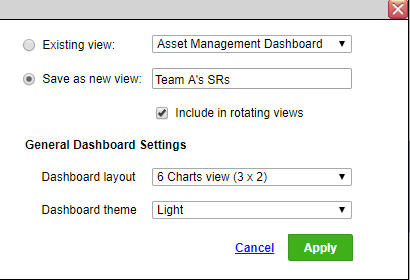
- On the top of the page, Additional Settings.
- In the popup that opens, select Save as a New View and then enter a name for your new view. You can also choose whether or not this screen will be included in the rotation of Dashboard views (more information about rotating views can be found here).

- Click Apply. Your new view is saved, and you can now select the charts that you would like to appear on it (see below).
Selecting the charts for each view
Each Manager Dashboard view can have its own charts.
To customize a view
- From the View drop-down, select the view you want to edit.
- Click on a chart to select it. The selected chart has a green border.
- On the right sidebar, choose the chart you want from the list.
- (Optional) Filter the contents of the chart according to your needs and then click Submit. See below for instructions for filtering charts.
- Repeat steps 4 - 6 for each of the charts, until the view shows exactly those charts you desire.
- Click Submit.
For a complete list and description of Dashboard charts, please see the table at the bottom of this page.
Filtering the contents of each chart
Many of the charts available to you in the Dashboard have filtering options so that you can focus the results displayed in the chart. The filtering options are different for each chart. Feel free to experiment with the different options until you're satisfied with the way the chart looks.
To filter a chart
- Click on the chart you would like to filter. The selected chart has a green border. Filter options for the chart appear in the right sidebar.
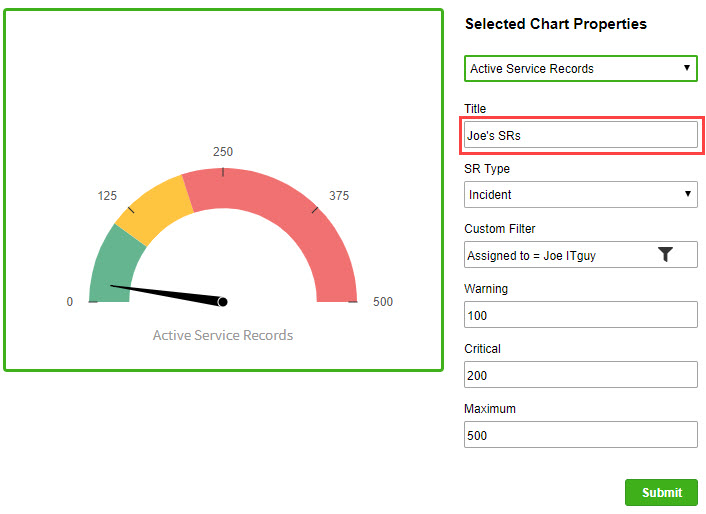
- Enter a new Title for your chart. This is important if you use the same chart several times with different filters, as without a unique title, you will not be able to differentiate between the charts.
- Many charts allow you to use the Expression Builder to specify exactly which results will appear on the chart. Use the Expression Builder to narrow the chart's results.
- Several charts have unique fields that allow you to modify specific aspects of the chart. For example, the Active Service Record chart allows you to specify the shading on the chart: where the Warning (yellow), Critical (red) and Maximum (last number on the dial) zones are. Fill out any unique fields now.
- Click Submit to save your filtered chart.
Creating an active service records chart that shows only incidents assigned to Joe
Changing the theme or layout
You can select to display your dashboard against a light or dark background. You can also set the dashboard to display four or six charts in all your views.
To set the theme
- On the top of the page, Additional Settings.
- From the Dashboard Theme drop-down list, select a light or Dark theme.
- Click Apply.
To set the layout
- On the top of the page, Additional Settings.
- From the Dashboard Layout drop-down list, select to display 4 or 6 charts.
- Click Apply.

Changing the View Permission
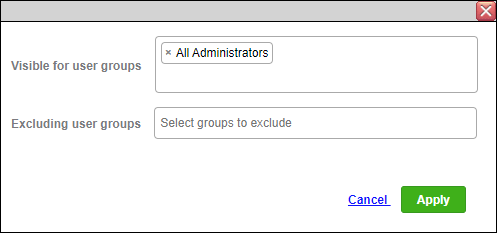
You can select which admin groups can or cannot access specific dashboard views
To set the group permissions on a view
- Select the view from the view drop-down list.
- Click Visibility to Groups.
- In the Visible for User Groups field enter the groups that you want to allow to access the view or enter the names of the groups who cannot access the view in the Excluding User Groups field.
- Click Apply.

Charts available for the Manager Dashboard
The following table lists each chart in the Manager Dashboard and what it shows. All service records that appear in the charts by date appear according to the request time.
| Chart Name | Y Axis | X Axis | Summary |
|---|---|---|---|
| Active Service Records | N/A | N/A | Shows a dial, reminiscent of a speedometer, with a needle that points to the number of active service records on your Service Desk. The dial is split into Normal (green), Warning (yellow), and Critical (red) zones. |
| Open Service Records by Category | Categories | # service records | Shows you the categories with the most service records submitted during the chosen time frame and how many service records were submitted in each of those categories. |
| Open Service Records Per Company | Companies | # service records | Shows you the companies with the most service records submitted during the chosen time frame and how many service records were submitted by each of those companies. |
| Open Service Records by Day | # service records | Days | Shows a line graph with the number of service records submitted each day. |
| Open Service Records by Week | # service records | Weeks | Shows a line graph with the number of service records submitted each week. |
| Open Service Records by Month | # service records | Months | Shows a line graph with the number of service records submitted each month. |
| Active Service Records by Category | Categories | # service records | Shows you the categories with the most active service records and how many service records are in each of those categories. An active service record is any service record that has an open status class. |
| Service Records Overview | N/A | N/A | Shows a pie chart with the number of service records on your Service Desk grouped by one of the following: Category, Sub category, SR type, Process Manger, Action Item Status, Action Item Assigned to, Action Item Admin Group, and Action Item Priority. |
| Action Items Overview | N/A | N/A | Shows a pie chart with the number of action items on your Service Desk grouped by one of the following: Category, SR type, Status, Assigned to, Urgency, Company, Department, Location, Priority, SR custom list 1 and 2, and Source. |
| Open Action Items | N/A | N/A | Shows a dial, reminiscent of a speedometer, with a needle that points to the number of open action items on your Service Desk. The dial is split into Normal (green), Warning (yellow), and Critical (red) zones. |
| Action items by Category | Categories | # action items | Shows you the categories with the most action items and how many action items are in each of those categories. |
| Inventory Overview - Assets | # assets | Age in years | Shows a bar chart with the number of assets in each age range. |
| Inventory Overview - CPU | N/A | N/A | Shows a pie chart with the number of each type of CPU you have running in your computers. |
| Inventory Overview - Operating System | N/A | N/A | Shows a pie chart with the number of each type of operating system you have running on your computers. |
| Inventory Overview | N/A | N/A | Shows a pie chart with the number of assets in your inventory grouped by one of a number of possible groupings. |
| Highest values | Selectable | Selectable | Shows you the top five highest values for any of a number of variables. For example, view the categories with the highest average number of activities, or view the administrators with the highest number of assigned service records. |
| Service Breaches | Category, Administrator, or Company | # breaches | View the five categories, administrators, or companies with the most service breaches. You can use any of the timers for calculating service breaches, and you can specify the elapsed time in hours before a service breach occurs. |
| Service Quality by Timer | Timer | Time period | Shows a line chart of the average timer value for all SRs by the day they were opened. An example using the time to repair timer: three SRs were opened on day X, and the average time to repair for all three SRs was 3 hours. In this example, there will be a point on the graph with time to repair = 3 hours that appears above day X. |
| Active Breaches | N/A | N/A | Shows a dial, reminiscent of a speedometer, with a needle that points to the number of active breaches in your Service Desk. The dial is split into Normal (green), Warning (yellow), and Critical (red) zones. An active breach is any SR that's in an open status class and has passed the indicated threshold in hours for timer 1 (time to repair by default). |
| Highest Project Values | # projects | Selectable | This chart shows you a bar chart with either a) the five managers assigned the most projects, b) the five categories with the most projects, c) the five projects with the highest raw estimations, or d) the five groups that have requested the most projects. |
| Next Due Date Projects | Length of project in days | Project title | Shows the next five upcoming projects and the number of days the project is expected to last. Projects are included in this chart based upon start date, and must also include an end date to appear. If there aren't five projects with a start date in the future, past projects will be shown as well. |
| SLA Current Grade | N/A | N/A | Shows a dial, reminiscent of a speedometer, with a needle that points to the current SLA grade. For this chart, you can choose which agreement and which measurement to show results for. Leave the filters blank to show an average for all SLAs/measurements. |
| SLA History | Grade | Months | Shows a line graph of your SLA grade over time. For this chart, you can choose which agreement and which measurement to show results for. Leave the filters blank to show an average for all SLAs/measurements. |